

To investigate whether economic events influence presidential elections, draw a scatter diagram and estimate the equation Y
Question:
To investigate whether economic events influence presidential elections, draw a scatter diagram and estimate the equation Y = α + βX + ε using the Table 8.13 data on X, the change in the unemployment rate during a presidential election year, and Y, the percentage of the vote for major party presidential candidates received by the incumbent party.
a. Does the estimated coefficient of X have a plausible sign and magnitude?
b. Test at the 5 percent level the null hypothesis that β = 0.
c. Does the intercept have a plausible magnitude?
d. Test at the 5 percent level the null hypothesis that α = 50.
e. How close is the predicted value of Y in 2008, when X = 1.2, to the actual value, Y = 46.3?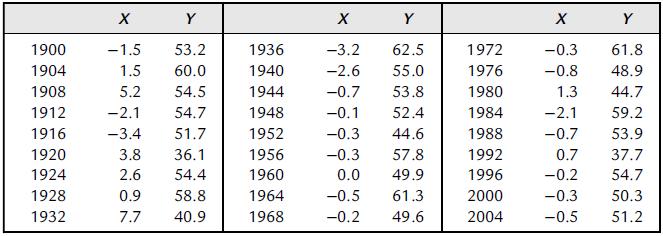
Step by Step Answer:

This question has not been answered yet.
You can Ask your question!


Essential Statistics Regression And Econometrics
ISBN: 9780123822215
1st Edition
Authors: Gary Smith
