

Use a histogram with intervals 09.99, 1014.99, 1519.99, and 2034.99 to summarize the data in Table 2.11
Question:
Use a histogram with intervals 0–9.99, 10–14.99, 15–19.99, and 20–34.99 to summarize the data in Table 2.11 on annual inches of precipitation from 1961 to 1990 at the Los Angeles Civic Center. Be sure to show your work.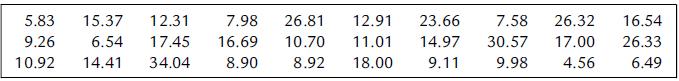
Fantastic news! We've Found the answer you've been seeking!
Step by Step Answer:

Answered By
Muhammad Ahtsham Shabbir
I am a professional freelance writer with more than 7 years’ experience in academic writing. I have a Bachelor`s Degree in Commerce and Master's Degree in Computer Science. I can provide my services in various subjects.
I have professional excellent skills in Microsoft ® Office packages such as Microsoft ® Word, Microsoft ® Excel, and Microsoft ® PowerPoint. Moreover, I have excellent research skills and outstanding analytical and critical thinking skills; a combination that I apply in every paper I handle.
I am conversant with the various citation styles, among them; APA, MLA, Chicago, Havard, and AMA. I also strive to deliver the best to my clients and in a timely manner.My work is always 100% original. I honestly understand the concern of plagiarism and its consequences. As such, I ensure that I check the assignment for any plagiarism before submission.
392+ Reviews
587+ Question Solved
Related Book For 

Essential Statistics Regression And Econometrics
ISBN: 9780123822215
1st Edition
Authors: Gary Smith
Question Posted:
