

Use the data in Exercise 3.29 to make a scatter diagram with the P/E ratio on the
Question:
Use the data in Exercise 3.29 to make a scatter diagram with the P/E ratio on the horizontal axis and the return on the vertical axis. Does there appear to be a positive relationship, negative relationship, or essentially no relationship?
Exercise 3.29
In the early 1970s, many investors were infatuated by the Nifty 50—a group of 50 growth stocks that were thought to be so appealing that they should be bought and never sold, regardless of price. Table 3.4 shows the price/earnings (P/E) ratio in December 1972 and the annualized stock return (R) from December 31, 1972, through December 31, 2001, for each of these 50 stocks. Calculate the mean and median values of the returns. Explain why these are not equal.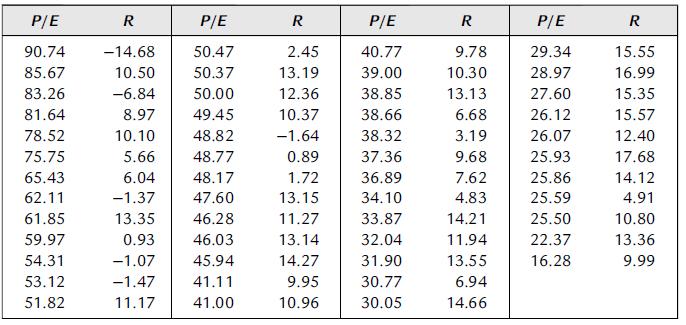
Step by Step Answer:


Essential Statistics Regression And Econometrics
ISBN: 9780123822215
1st Edition
Authors: Gary Smith
