

Use these household taxable income data (in thousands of dollars) to make a histogram, using intervals equal
Question:
Use these household taxable income data (in thousands of dollars) to make a histogram, using intervals equal to the federal income tax brackets shown in Table 2.5: 10, 20, 30, 40, 50, 60, 70, 80, 90, 100.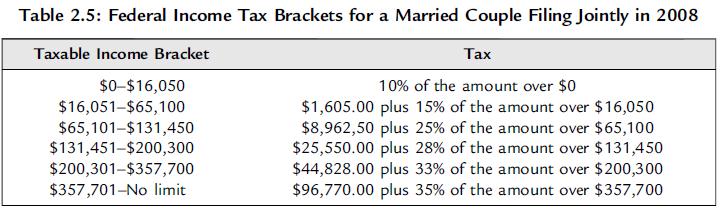
Fantastic news! We've Found the answer you've been seeking!
Step by Step Answer:

Answered By
Diksha Bhasin
I have been taking online teaching classes from past 5 years, i.e.2013-2019 for students from classes 1st-10th. I also take online and home tuitions for classes 11th and 12th for subjects – Business Studies and Economics from past 3 years, i.e. from 2016-2019. I am eligible for tutoring Commerce graduates and post graduates. I am a responsible for staying in contact with my students and maintaining a high passing rate.
1+ Reviews
10+ Question Solved
Related Book For 

Essential Statistics Regression And Econometrics
ISBN: 9780123822215
1st Edition
Authors: Gary Smith
Question Posted:
