

The following table shows UK nominal GDP for the years 1990, 1992, 2008, 2010, 2019 and 2021.
Question:
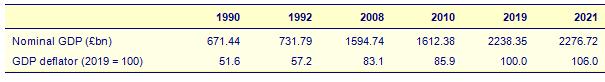
The following table shows UK nominal GDP for the years 1990, 1992, 2008, 2010, 2019 and 2021. It also shows the GDP deflator, where 2019 = 100.
1. Work out the real GDP for each year based on 2019 prices.
2. By what percentage did nominal GDP grow between 1990 and 1992; between 1992 and 2008; between 2008 and 2010; between 2010 and 2019; and between 2019 and 2021?
3. Now repeat (2) but this time for real GDP.
Fantastic news! We've Found the answer you've been seeking!
Step by Step Answer:
1 See table below 1990 1992 2008 2010 2019 2021 100 GDP deflato...View the full answer

Answered By
GERALD KAMAU
non-plagiarism work, timely work and A++ work
6+ Reviews
11+ Question Solved
Related Book For 

Essential Economics For Business
ISBN: 9781292728940
7th Edition
Authors: John Sloman, Elizabeth Jones
Question Posted:
