

Use the data in the following table to calculate the GDP deflator for each year (values are
Question:
Use the data in the following table to calculate the GDP deflator for each year (values are in billions of dollars).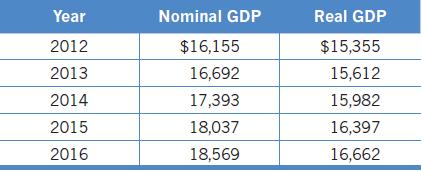
Which year from 2013 to 2016 saw the largest percentage increase in the price level, as measured by changes in the GDP deflator? Briefly explain.
Fantastic news! We've Found the answer you've been seeking!
Step by Step Answer:

Answered By
Sandip Nandnawar
I am a B.E (Information technology) from GECA and also have an M.C.M from The University of RTMNU, MH.
I worked as a software developer (Programmer and TL). Also working as an expert for the last 6 years and deal with complex assessment and projects. I have a team and lead a team of experts and conducted primary and secondary research. I am a senior software engg and senior expert and deal with all types of CSE and IT and other IT-related assessments and projects and homework.
1+ Reviews
10+ Question Solved
Related Book For 

Essentials Of Economics
ISBN: 9780134797731
6th Edition
Authors: R. Glenn Hubbard, Anthony Patrick O brien
Question Posted:
