

The following table gives a football teams season-ticket sales, percentage of games won, and number of active
Question:
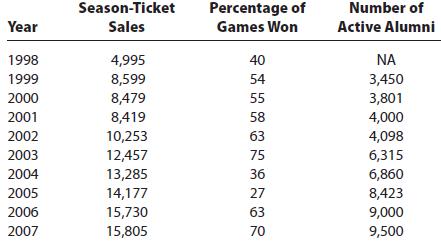
The following table gives a football team’s season-ticket sales, percentage of games won, and number of active alumni for the years 1998–2007.
a. Estimate a regression model for sales = Percentage of games won.
b. Estimate a regression model for sales = Number of active alumni.
c. If sales is the dependent variable, which of the two independent variables do you think explains sales better? Explain.
Fantastic news! We've Found the answer you've been seeking!
Step by Step Answer:
The given data is Year Sales Percentage of games Won Number of Active Alumni 1998 4995 40 0 1999 8599 54 3450 2000 8479 55 3801 2001 8419 58 4000 2002 ...View the full answer

Related Book For 
Essentials of marketing research
ISBN: 978-1439080900
4th edition
Authors: William G. Zikmund, Barry J. Babin
Question Posted:
