

A local fast-food restaurant normally sells coffee in three sizessmall, medium, and largeat three different prices. Recently
Question:
A local fast-food restaurant normally sells coffee in three sizes—small, medium, and large—at three different prices. Recently they had a special sale, charging only $1 for any sized coffee. During the sale, an employee recorded the number of each coffee size that was purchased on Wednesday morning. The following Wednesday, when prices had returned to normal, she again recorded the number of coffees sold for each size. The results are shown in the following table.
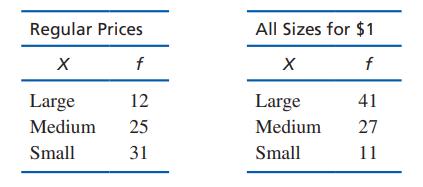
a. What kind of graph would be appropriate for showing the distribution of coffee sizes for each of the two time periods?
b. Draw the two frequency distribution graphs.
c. Based on your two graphs, did the sale have an influence on the size of coffee that customers ordered?
Step by Step Answer:
a The size of the drink is an ordinal scale so a bar ...View the full answer


Essentials Of Statistics For The Behavioral Sciences
ISBN: 9780357365298
10th Edition
Authors: Frederick J Gravetter, Larry B. Wallnau, Lori Ann B. Forzano, James E. Witnauer
