

Let denote the proportion of voters in a certain state who favor a particular proposed constitutional
Question:
Let π denote the proportion of voters in a certain state who favor a particular proposed constitutional amendment. Consider testing H0: π = .5 versus Ha: π > .5 at significance level .05 based on a sample of size n = 50.
a. Suppose that H0 is in fact true. Use Appendix Table 1 (our table of random numbers) to simulate selecting a sample, and use the resulting data to carry out the test.
b. If you repeated Part (a) a total of 100 times (a simulation consisting of 100 replications), how many times would you expect H0 to be rejected?
c. Now suppose that π = .6, which implies that H0 is false. Again, use Appendix Table 1 to simulate selecting a sample, and carry out the test. If you repeated this a total of 100 times, would you expect H0 to be rejected more frequently than when H0 is true?
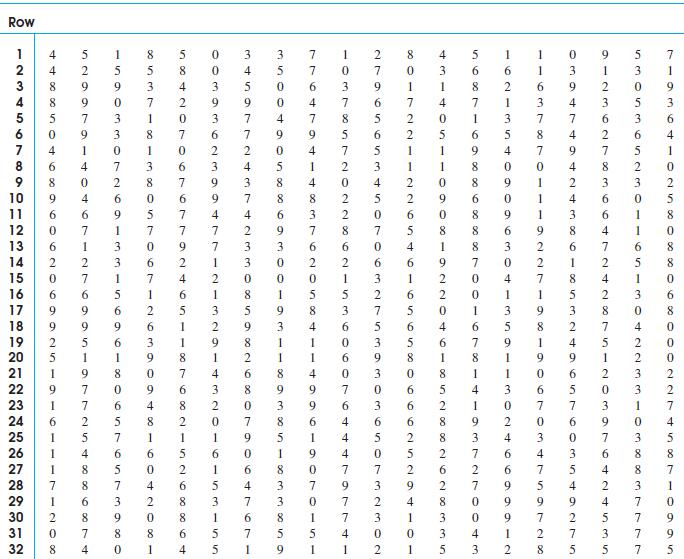
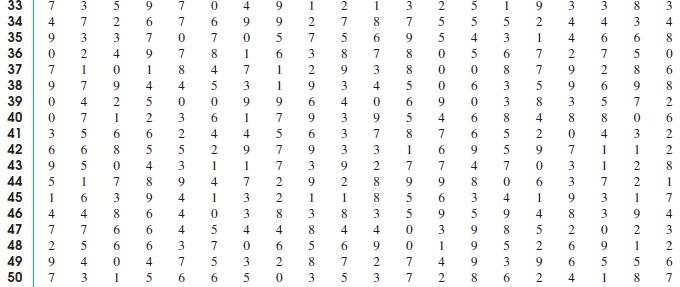
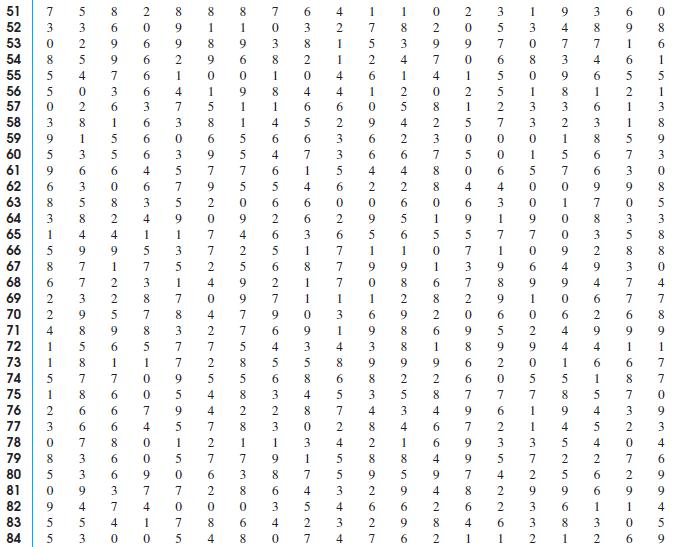
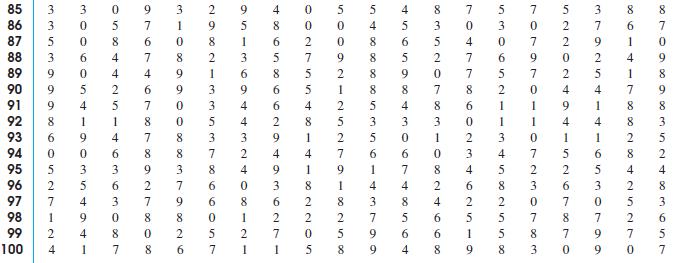
Data from Appendix table 1 Random Numbers
Step by Step Answer:


Introduction To Statistics And Data Analysis
ISBN: 9780495118732
3rd Edition
Authors: Roxy Peck, Chris Olsen, Jay L. Devore
