

Question: The following normal probability plot was constructed using part of the data appearing in the paper Trace Metals in Sea Scallops (Environmental Concentration and Toxicology
The following normal probability plot was constructed using part of the data appearing in the paper “Trace Metals in Sea Scallops” (Environmental Concentration and Toxicology 19: 1326–1334).
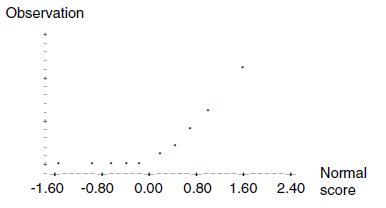
The variable under study was the amount of cadmium in North Atlantic scallops. Do the sample data suggest that the cadmium concentration distribution is not normal? Explain.
Observation D -1.60 -0.80 0.00 0.80 1.60 Normal 2.40 score
Step by Step Solution
3.43 Rating (156 Votes )
There are 3 Steps involved in it
A normal probability plot is a graphical technique for assessing whether or not a data set is approx... View full answer

Get step-by-step solutions from verified subject matter experts