

Question: The paper cited in Exercise 5.69 gave a scatterplot in which x values were for anterior teeth. Consider the following representative subset of the data:
The paper cited in Exercise 5.69 gave a scatterplot in which x values were for anterior teeth. Consider the following representative subset of the data:
a. Calculate the predicted values and residuals.
b. Use the results of Part (a) to obtain SSResid and r2.
c. Does the least-squares line appear to give accurate predictions? Explain your reasoning.
Data from Exercises 69
The paper “Root Dentine Transparency: Age Determination of Human Teeth Using Computerized Densitometric Analysis” (American Journal of Physical Anthropology [1991]: 25–30) reported on an investigation of methods for age determination based on tooth characteristics. With y = age (in years) and x = percentage of root with transparent dentine, a regression analysis for premolars gave n = 36, SSResid = 5987.16, and SSTo = 17,409.60. Calculate and interpret the values of r2 and se.
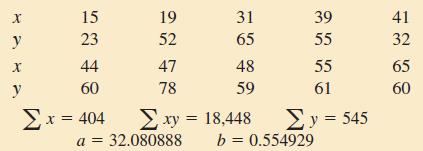
X y X y 15 23 44 60 2 x = 404 19 52 47 78 31 65 a = 32.080888 48 59 xy = 18,448 39 55 b = 0.554929 55 61 y = 545 41 32 65 60
Step by Step Solution
3.45 Rating (161 Votes )
There are 3 Steps involved in it
To calculate the predicted values and residuals we need to have the equation of the leastsquares regression line Unfortunately the equation of the reg... View full answer

Get step-by-step solutions from verified subject matter experts