

Question: Table 2-2 on page 45 is a frequency distribution summarizing the IQ scores of a group of children with low lead exposure. Is it possible
Table 2-2 on page 45 is a frequency distribution summarizing the IQ scores of a group of children with low lead exposure. Is it possible to identify the original list of the 78 individual IQ scores from Table 2-2? Why or why not?
Table 2-2
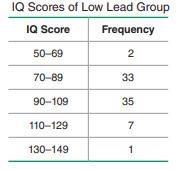
IQ Scores of Low Lead Group IQ Score Frequency 50-69 2 70-89 33 90-109 35 110-129 7 130-149 1
Step by Step Solution
★★★★★
3.49 Rating (156 Votes )
There are 3 Steps involved in it
1 Expert Approved Answer
Step: 1 Unlock

The frequency distribution presented in Table 22 summarizes the IQ scores of a group of children wit... View full answer
Question Has Been Solved by an Expert!
Get step-by-step solutions from verified subject matter experts
Step: 2 Unlock
Step: 3 Unlock