

Question: Students often are confused by the difference between a normal distribution curve, as in Exercise 22, and a random distribution. Excel has a variable rand()
Students often are confused by the difference between a normal distribution curve, as in Exercise 22, and a random distribution. Excel has a variable rand() that will generate random numbers between 0 and 1. (See the Excel Help menu to see how to use it.) Plot a random curve for the set of 100 numbers from 0 to 99.
Use the Chart–Column representation. Observe its shape and calculate its mean and standard distribution.
Exercise 22
The equation for a normal error curve is
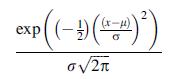
or in spreadsheet script:

Plot a normal distribution curve for the set of 100 numbers from 0 to 99.
(x-) exp
Step by Step Solution
3.46 Rating (162 Votes )
There are 3 Steps involved in it
To construct a normal distribution curve for a set of 100 numbers 0 to 99 observe its shape and use ... View full answer

Get step-by-step solutions from verified subject matter experts