

Question: Using the force vs. time graph (Figure 14.6) for human resistance to g forces, predict whether Stapp suffered serious injury in the course of his
Using the force vs. time graph (Figure 14.6) for human resistance to g forces, predict whether Stapp suffered serious injury in the course of his record-breaking trip.
In the 1950s when Air Force Colonel John Paul Stapp volunteered to ride a rocket sled to test the resistance of the human body to g forces. The sled accelerated from 0 to 625 miles per hour in 5.0 seconds. Then the sled hit a water brake and decelerated in 3.0 seconds to a standstill. Assume that Stapp was rigidly strapped into the sled and that he had a mass of 75 kg.
Figure 14.6
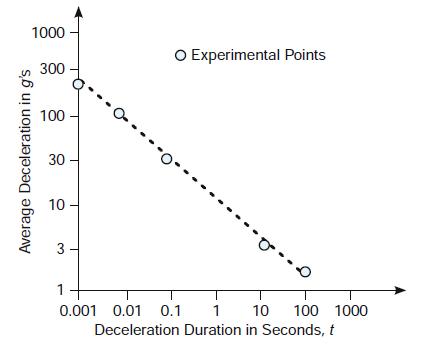
1000 O Experimental Points 300 100 30 10 3 1 0.001 0.01 0.1 1 10 100 1000 Deceleration Duration in Seconds, t Average Deceleration in g's
Step by Step Solution
3.40 Rating (163 Votes )
There are 3 Steps involved in it

Get step-by-step solutions from verified subject matter experts