

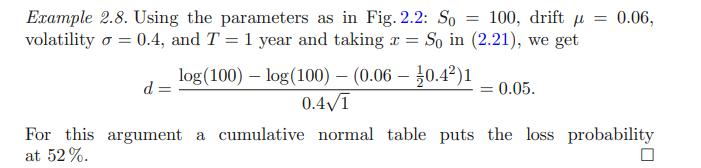
Investigate how the probability of loss in Example 2.8 varies as a function of volatility. Make a
Question:
Investigate how the probability of loss in Example 2.8 varies as a function of volatility. Make a graph of loss vs. volatility.
Step by Step Answer:

This question has not been answered yet.
You can Ask your question!
Related Book For 

Question Posted:
