

Question: Use Algorithm 8 to construct several figures such as Fig. 2.4 and observe the extent to which correlated prices trend together (recall that it is
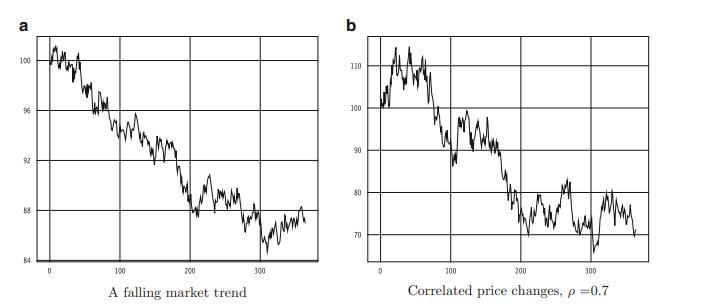
Use Algorithm 8 to construct several figures such as Fig. 2.4 and observe the extent to which correlated prices trend together (recall that it is the increments that are correlated, not the prices themselves). For each run, calculate the correlation between the prices.
Data given in Algorithm 8
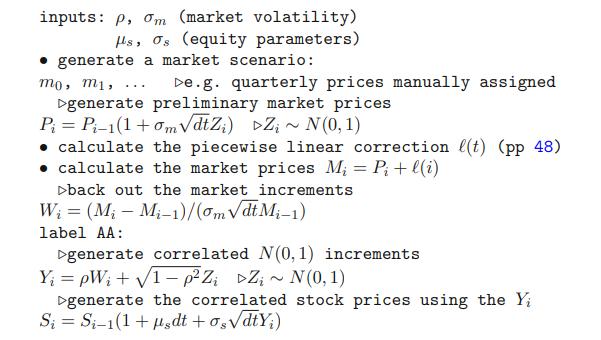
Figure 2.4:
inputs: p, om (market volatility) Hs, Os (equity parameters) generate a market scenario: mo, m1, ... De.g. quarterly prices manually assigned generate preliminary market prices Pi = Pi-1(1 + 0m VdtZi) Zi ~ N(0, 1) calculate the piecewise linear correction l(t) (pp 48) calculate the market prices M = Pi + l(i) back out the market increments W = (M - M-1)/(om dt Mi-1) label AA: generate correlated N(0, 1) increments Y = pW+1-pZ Z ~ N(0,1) generate the correlated stock prices using the Yi Si = Si-1(1 + pdt +0,dtY;)
Step by Step Solution
3.31 Rating (160 Votes )
There are 3 Steps involved in it

Get step-by-step solutions from verified subject matter experts