

The table shows experimental values of the variables x and y. a. Draw the graph of ln
Question:
The table shows experimental values of the variables x and y.
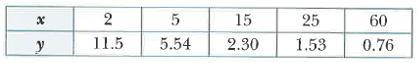
a. Draw the graph of ln y against x.
b. Express y in terms of x.
An alternate method for obtaining the relationship between x and y is to plot y on the vertical axis and lg x on the horizontal axis.
c. Without drawing a second graph, estimate the gradient and the intercept on the vertical axis of this graph.
Fantastic news! We've Found the answer you've been seeking!
Step by Step Answer:
Draw the graph of ln y against x To draw the graph of ln y against x i first need to calculate the n...View the full answer

Answered By
Loise Ndungu
I have five years of experience as a writer. As I embark on writing your papers from the prologue to the epilogue, my enthusiasm is driven by the importance of producing a quality product. I put premium product delivery as my top priority, as this is what my clients are seeking and what makes me different from other writers. My goal is to craft a masterpiece each time I embark on a freelance work task! I'm a freelance writer who provides his customers with outstanding and remarkable custom writings on various subjects. Let's work together for perfect grades.
78+ Reviews
224+ Question Solved
Related Book For 

Cambridge IGCSE And O Level Additional Mathematics Coursebook
ISBN: 9781108411660
2nd Edition
Authors: Sue Pemberton
Question Posted:
