

The table shows experimental values of the variables x and y. The variables are known to be
Question:
The table shows experimental values of the variables x and y.
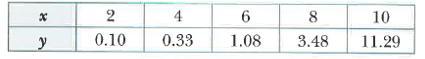
The variables are known to be related by the equation y = 10a × bx, where a and b are constants.
a. Draw the graph of lg y against x.
b. Use your graph to estimate the value of a and the value of b.
c. Estimate the value of x when y = 5.
Step by Step Answer:

This question has not been answered yet.
You can Ask your question!
Related Book For 
Cambridge IGCSE And O Level Additional Mathematics Coursebook
ISBN: 9781108411660
2nd Edition
Authors: Sue Pemberton
Question Posted:
