

Horizontal analysis (trend analysis) percentages for Phoenix Companys sales revenue, cost of goods sold, and expenses are
Question:
Horizontal analysis (trend analysis) percentages for Phoenix Company’s sales revenue, cost of goods sold, and expenses are listed here.
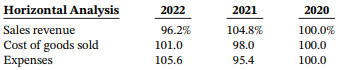
Explain whether Phoenix’s net income increased, decreased, or remained unchanged over the 3-year period.
Fantastic news! We've Found the answer you've been seeking!
Step by Step Answer:
Comparing the percentages presented results in the following conclusions T...View the full answer

Answered By
OTIENO OBADO
I have a vast experience in teaching, mentoring and tutoring. I handle student concerns diligently and my academic background is undeniably aesthetic
3+ Reviews
10+ Question Solved
Related Book For 

Financial Accounting Tools for Business Decision Making
ISBN: 978-1119493631
9th edition
Authors: Paul D. Kimmel, Jerry J. Weygandt, Donald E. Kieso
Question Posted:
