

Top managers of Ryan Products, Inc., have asked you to compare the companys profit performance and financial
Question:
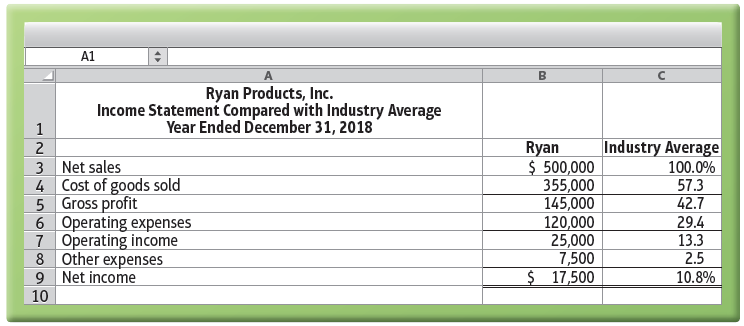
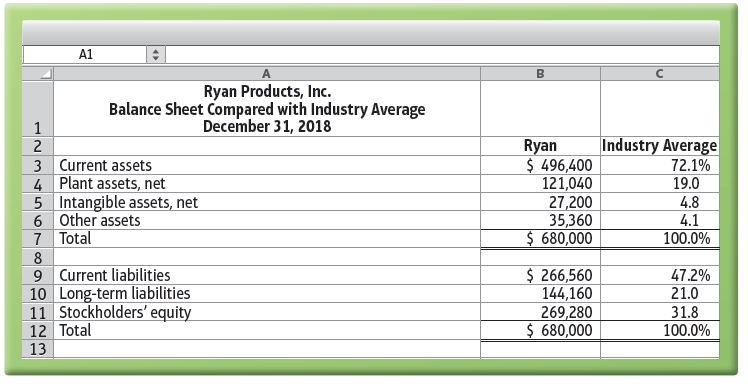
Top managers of Ryan Products, Inc., have asked you to compare the company’s profit performance and financial position with the average for the industry. The company’s accountant has given you the business’s income statement, balance sheet, and industry data:
Requirements
1. Prepare a common-size income statement and balance sheet for Ryan Products. The first column of each statement should present the company’s common-size statement, and the second column should show the industry averages.
2. For the profitability analysis, compare the company’s
(a) Ratio of gross profit to net sales,
(b) Ratio of operating income to net sales,
(c) Ratio of net income to net sales with the industry averages. Is the company’s profit performance better or worse than the average for the industry?
3. For the analysis of financial position, calculate Ryan Products’
(a) Ratios of current assets and current liabilities to total assets
(b) Ratio of stockholders’ equity to total assets.
Compare these ratios with the industry averages. Is the company’s financial position better or worse than the average for the industry?
Step by Step Answer:
Ryan Products Inc CommonSize Income Statement Compared to Industry Average Year Ended December 31 20...View the full answer


Financial Accounting
ISBN: 978-0134725987
12th edition
Authors: C. William Thomas, Wendy M. Tietz, Walter T. Harrison Jr.
