

Question: Construct a candlestick chart for the data presented in Exercise 12. Use the following data to construct a stock bar chart for the 5-day period.
Construct a candlestick chart for the data presented in Exercise 12.
Use the following data to construct a stock bar chart for the 5-day period.
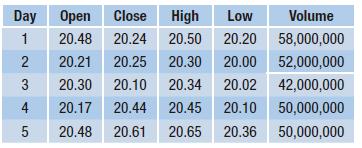
Day Open Close High Low 1 20.48 20.24 20.50 20.20 2 20.21 20.25 20.30 20.00 3 20.30 20.10 20.34 20.02 4 20.17 20.44 20.45 20.10 5 20.48 20.61 20.65 20.36 Volume 58,000,000 52,000,000 42,000,000 50,000,000 50,000,000
Step by Step Solution
★★★★★
3.41 Rating (167 Votes )
There are 3 Steps involved in it
1 Expert Approved Answer
Step: 1 Unlock

To create a candlestick chart for the given data we need to represent each days stock price ... View full answer
Question Has Been Solved by an Expert!
Get step-by-step solutions from verified subject matter experts
Step: 2 Unlock
Step: 3 Unlock