

The senior class is planning a graduation trip. The trip committee surveyed the 250 seniors asking the
Question:
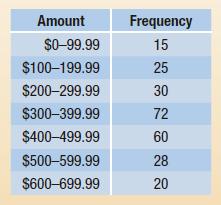
The senior class is planning a graduation trip. The trip committee surveyed the 250 seniors asking the amount they were willing to spend on the entire trip. The survey results are shown in this table.
a. Extend the table to include the columns “Relative Frequency,” “Cumulative Frequency,” and “Relative Cumulative Frequency.” Determine the values under each column heading. Round your answers to three decimal places.
b. Using your table from part a, what percent of the senior class were willing to spend between $200 and $299.99?
c. Using your table from part a, how many seniors surveyed indicated that they would be willing to spend up to $499.99?
d. Using your table from part a, what percent of the seniors were willing to spend no more than $399.99?
e. Since most of the responses were in the $300–399.99 interval, the trip committee made a frequency table of the actual amounts recorded in that interval, as shown here:
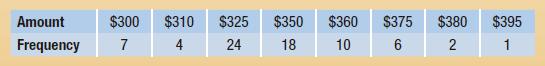
What are the percentile ranks for $325 and $350?
Step by Step Answer:
ANSWER a Amount Frequency Relative Frequency Cumulative Frequency Relative Cumulative Frequency 0999...View the full answer


Financial Algebra Advanced Algebra With Financial Applications
ISBN: 9781337271790
2nd Edition
Authors: Robert Gerver, Richard J. Sgroi
