

Question: Use the candlestick chart to answer the questions. a. On which days were opening prices higher than the closing prices? b. On which days were
Use the candlestick chart to answer the questions.
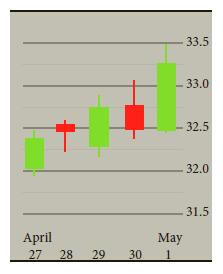 a. On which days were opening prices higher than the closing prices?
b. On which days were the closing prices higher than the opening prices?
c. What was the approximate closing price on April 28?
d. What was the approximate high price on May 1?
e. What was the difference between the lowest price and the highest price recorded for this time period?
f. What does the very short line at the bottom of the May 1 candlestick indicate?
g. Had the chart used white and black candlesticks, which days would be white and which days would be black?
h. On which consecutive days was the closing price of the first day higher than the opening price of the second day?
April 27 28 29 30 May 1 33.5 33.0 32.5 32.0 31.5
Step by Step Solution
3.53 Rating (160 Votes )
There are 3 Steps involved in it
To answer your questions based on the provided candlestick chart a On which days were opening prices higher than the closing prices Red candlesticks r... View full answer

Get step-by-step solutions from verified subject matter experts