Calculate the degree of operating gearing for Strategy 2 at the different levels of sales output mentioned
Question:
Calculate the degree of operating gearing for Strategy 2 at the different levels of sales output mentioned in Example 2.7.
Data from Example 2.7
Lethargo plc has recently been formed to produce vacuum cleaners. The business is now considering which one of two possible strategies should be adopted:
Strategy 1: outsource production of all the parts and components needed for the vacuum cleaners and focus on assembling the parts and distributing the assembled cleaners. Under this strategy, variable operating costs would be 70 percent of the total sales output. Fixed costs would be £3 million per year.
Strategy 2: make all of the parts and components needed for the vacuum cleaners and simply buy in the raw materials needed. Under this strategy, variable operating costs would be 40 per cent of the total sales output. Fixed costs would be £18 million per year.
The most likely level of sales under both strategies is £60 million. However, the range of sales is forecast to be between £30 million and £70 million.
We can see that Strategy 1 has a much higher level of operating gearing than Strategy 2. Let us now consider the effect of these different levels of gearing on operating profit for different levels of sales output.
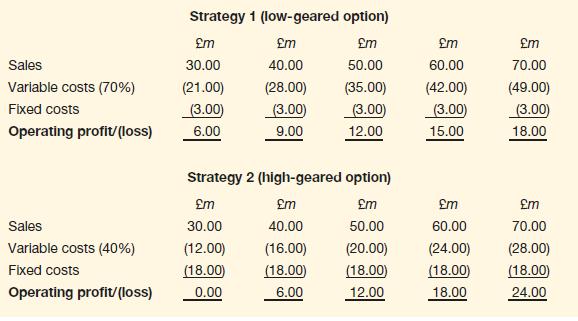
We can see that Strategy 2 is a riskier option than Strategy 1. If the sales output is low, operating profits will be more badly affected than under Strategy 1. This is because fixed costs, which are incurred irrespective of the level of sales output, are much higher. We can also see, however, that Strategy 2 has the potential to generate higher operating profits.
Step by Step Answer: