

The following table shows the annual returns over time for two stocks. Calculate each stock's expected return,
Question:
The following table shows the annual returns over time for two stocks.
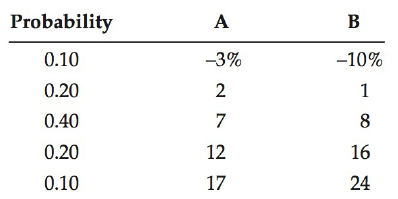
Calculate each stock's expected return, standard deviation, and coefficient of variation.
Fantastic news! We've Found the answer you've been seeking!
Step by Step Answer:
r A 013 022 047 0212 0117 7 r B 0110 021 048 0201...View the full answer

Answered By
JAPHETH KOGEI
Hi there. I'm here to assist you to score the highest marks on your assignments and homework. My areas of specialisation are:
Auditing, Financial Accounting, Macroeconomics, Monetary-economics, Business-administration, Advanced-accounting, Corporate Finance, Professional-accounting-ethics, Corporate governance, Financial-risk-analysis, Financial-budgeting, Corporate-social-responsibility, Statistics, Business management, logic, Critical thinking,
So, I look forward to helping you solve your academic problem.
I enjoy teaching and tutoring university and high school students. During my free time, I also read books on motivation, leadership, comedy, emotional intelligence, critical thinking, nature, human nature, innovation, persuasion, performance, negotiations, goals, power, time management, wealth, debates, sales, and finance. Additionally, I am a panellist on an FM radio program on Sunday mornings where we discuss current affairs.
I travel three times a year either to the USA, Europe and around Africa.
As a university student in the USA, I enjoyed interacting with people from different cultures and ethnic groups. Together with friends, we travelled widely in the USA and in Europe (UK, France, Denmark, Germany, Turkey, etc).
So, I look forward to tutoring you. I believe that it will be exciting to meet them.
2+ Reviews
10+ Question Solved
Related Book For 

Financial Management Theory And Practice
ISBN: 978-0176583057
3rd Canadian Edition
Authors: Eugene Brigham, Michael Ehrhardt, Jerome Gessaroli, Richard Nason
Question Posted:
