

Question: Using 2006 as the base year, prepare a trend analysis of the following data, and tell whether the situation shown by the trends is favorable
Using 2006 as the base year, prepare a trend analysis of the following data, and tell whether the situation shown by the trends is favorable or unfavorable. (Round your answers to one decimal place.)
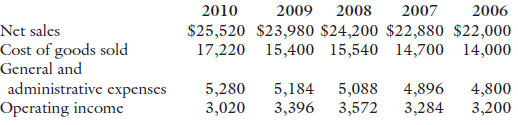
2007 2008 $25,520 $23,980 $24,200 $22,880 $22,000 15,400 15,540 14,700 14,000 2006 2010 2009 Net sales Cost of goods sold General and 17,220 administrative expenses Operating incomc 5,280 3,020 5,184 3,396 5,088 3,572 4,896 3,284 4,800 3,200
Step by Step Solution
3.46 Rating (159 Votes )
There are 3 Steps involved in it
2010 2009 2008 2007 2006 Net sales 1160 1090 1100 1040 1000 Cost of goods sold 1230 1100 1110 1... View full answer

Get step-by-step solutions from verified subject matter experts
Document Format (1 attachment)
1942_607428bb81a02_794569.xlsx
300 KBs Excel File