

Let us consider the extremely simplified and fictional balance sheet of a firm, reported in Table 1.1.
Question:
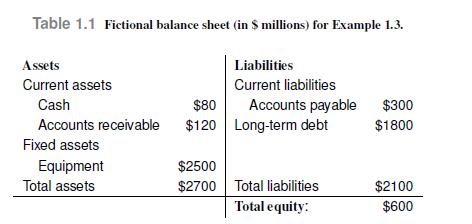
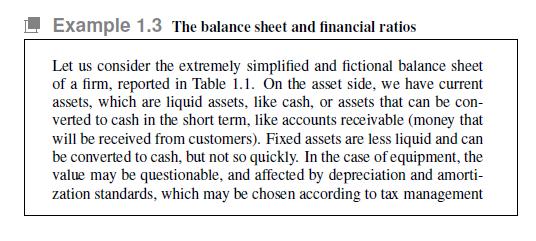
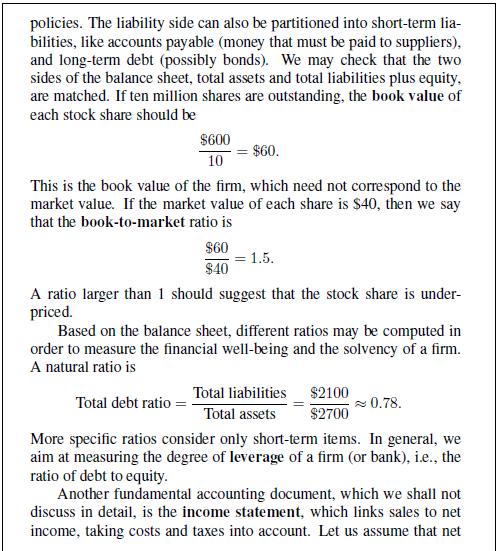
Let us consider the extremely simplified and fictional balance sheet of a firm, reported in Table 1.1. On the asset side, we have current assets, which are liquid assets, like cash, or assets that can be converted to cash in the short term, like accounts receivable (money that will be received from customers). Fixed assets are less liquid and can be converted to cash, but not so quickly. In the case of equipment, the value may be questionable, and affected by depreciation and amortization standards, which may be chosen according to tax management policies. The liability side can also be partitioned into short-term liabilities, like accounts payable (money that must be paid to suppliers), and long-term debt (possibly bonds). We may check that the two sides of the balance sheet, total assets and total liabilities plus equity, are matched. If ten million shares are outstanding, the book value of each stock share should be
\[\frac{\$ 600}{10}=\$ 60\]
This is the book value of the firm, which need not correspond to the market value. If the market value of each share is \(\$ 40\), then we say that the book-to-market ratio is
\[\frac{\$ 60}{\$ 40}=15\]
A ratio larger than 1 should suggest that the stock share is underpriced.
Based on the balance sheet, different ratios may be computed in order to measure the financial well-being and the solvency of a firm. A natural ratio is
\[\text { Total debt ratio }=\frac{\text { Total liabilities }}{\text { Total assets }}=\frac{\$ 2100}{\$ 2700} \quad 078\]
More specific ratios consider only short-term items. In general, we aim at measuring the degree of leverage of a firm (or bank), i.e., the ratio of debt to equity.
Another fundamental accounting document, which we shall not discuss in detail, is the income statement, which links sales to net income, taking costs and taxes into account. Let us assume that net income is \(\$ 200\) (million) for our fictional firm. Net income is used to define important ratios:
- Return on assets (ROA), the ratio of net income to total assets:
\[\frac{\$ 200}{\$ 2700} \quad 0074\]
- Return on equity (ROE), the ratio of net income to total equity:
\[\frac{\$ 200}{\$ 600} \quad 033\]
- Earnings per share (EPS), the ratio of net income to shares outstanding:
\[\frac{\$ 200}{10}=\$ 20\]
- Price-to-earnings (PE), the ratio of price per share to earning per share:
\[\frac{\$ 40}{\$ 20}=2\]
These ratios are also used to classify stock shares as follows:
- Value stocks are stocks that look undervalued, but could deliver long-term profits to shareholders. They may feature low PE and price-to-book ratios.
- Growth stocks, on the contrary, look overvalued with respect to current market, but they may promise further growth opportunities due to expanding markets, new products, etc. They are generally rather volatile.
Data From Table 1.1
Data From Example 1.3
Step by Step Answer:


An Introduction To Financial Markets A Quantitative Approach
ISBN: 9781118014776
1st Edition
Authors: Paolo Brandimarte
