

Question: Exhibit 5.24 presents balance sheets for Year 2 and Year 3 for Whole Foods Market, Inc.; Exhibit 5.25 presents income statements for Year 1 through
Exhibit 5.24 presents balance sheets for Year 2 and Year 3 for Whole Foods Market, Inc.; Exhibit 5.25 presents income statements for Year 1 through Year 3.
REQUIRED
a. For Year 3, prepare the standard decomposition of ROCE into margin, turnover, and leverage. Use average balances for balance sheet amounts.
b. Assume that all cash is operating cash (that is, no excess cash). Also assume that deferred lease liabilities are operating. Prepare the alternative decomposition of ROCE by computing NOPAT, net financing expense (after tax), operating profit margin, net operating assets turnover, operating ROA, leverage, and spread for Year 3. Use average balances for balance sheet amounts.
c. Use the same assumptions as in Requirement b, except that all cash is a financing asset (that is, all cash is excess cash) and deferred lease liabilities are a financing obligation. Prepare the alternative decomposition of ROCE by computing NOPAT, net financing expense (after tax), operating profit margin, net operating assets turnover, operating ROA, leverage, and spread for Year 3. Use average balances for balance sheet amounts.
d. Does the different treatment of financial assets and liabilities affect inferences you draw from the decomposition of ROCE? Explain.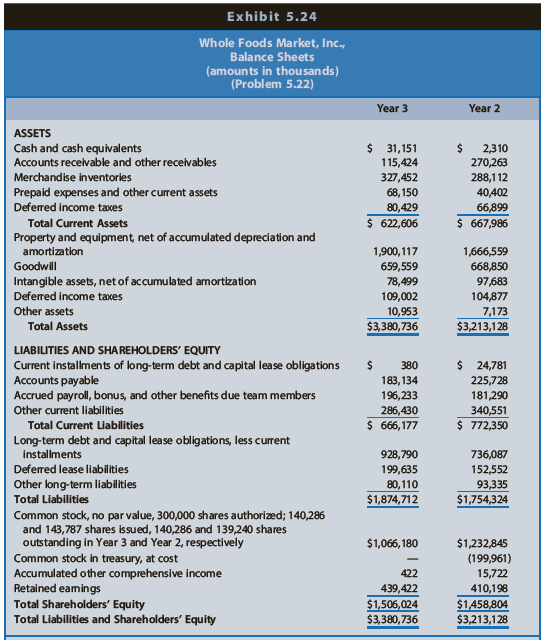
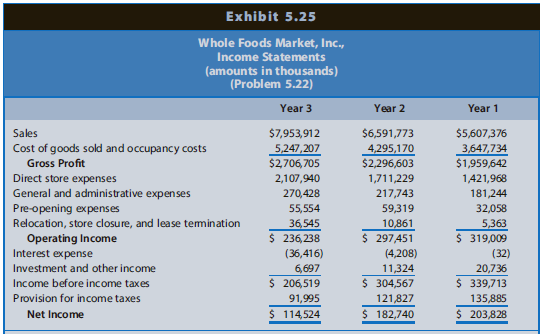
Exhibit 5.24 Whole Foods Market, Inc., Balance Sheets (amounts in thousands) (Problem 5.22) Year 3 Year 2 ASSETS $ 31,151 2$ Cash and cash equivalents Accounts receivable and other receivables 2,310 270,263 288,112 40,402 66,899 $ 667,986 115,424 327,452 68, 150 80,429 $ 622,606 Merchandise inventories Prepaid expenses and other current assets Deferred income taxes Total Current Assets Property and equipment, net of accumulated depreciation and amortization 1,900,117 659,559 78,499 1,666,559 668,850 97,683 104,877 7,173 $3,213,128 Goodwill Intangible assets, net of accumulated amortization Deferred income taxes Other assets Total Assets 109,002 10,953 $3,380,736 LIABILITIES AND SHAREHOLDERS' EQUITY $ 24,781 Current installments of long-term debt and capital lease obligations Accounts payable Accrued payroll, bonus, and other benefits due team members 380 183,134 196,233 286,430 $ 666, 177 225,728 181,290 340,551 $ 772,350 Other current liabilities Total Current Liabilities Long-term debt and capital lease obligations, less current installments 928,790 736,087 152,552 Deferred lease liabilities Other long-term liabilities Total Liabilities 199,635 80, 110 $1,874,712 93,335 $1,754,324 Common stock, no par value, 300,000 shares authorized; 140,286 and 143,787 shares issued, 140,286 and 139,240 shares outstanding in Year 3 and Year 2, respectively Common stock in treasury, at cost Accumulated other comprehensive income Retained eamings Total Shareholders' Equity Total Liabilities and Shareholders' Equity $1,066, 180 $1,232,845 (199,961) 15,722 422 439,422 410,198 $1458,804 $3,213,128 $1,506,024 $3,380,736 Exhibit 5.25 Whole Foods Market, Inc., Income Statements (amounts in thousands) (Problem 5.22) Year 3 Year 2 Year 1 $7,953,912 5,247,207 Sales $6,591,773 $5,607,376 3,647,734 $1,959,642 Cost of goods sold and occupancy costs 4,295,170 Gross Profit $2,706,705 $2,296,603 Direct store expenses General and administrative expenses Pre-opening expenses Relocation, store closure, and lease temination Operating Income Interest expense 2,107,940 1,711,229 1,421,968 270,428 55,554 36,545 $ 236,238 217,743 181,244 32,058 5,363 $ 319,009 59,319 10,861 $ 297,451 (36,416) (4,208) (32) Investment and other income 6,697 11,324 20,736 Income before income taxes $ 206,519 $ 304,567 $ 339,713 Provision for income taxes 91,995 121,827 135,885 Net Income $ 114,524 $ 182,740 $ 203,828
Step by Step Solution
3.48 Rating (168 Votes )
There are 3 Steps involved in it
a ROE MARGIN TURNOVER LEVERAGE 1145247953912 79539120533807363213128 05338073632131280515060241458804 144 2413 2224 773 b Effective Tax Rate 919952065... View full answer

Get step-by-step solutions from verified subject matter experts