

Question: Exhibit 6.18 presents selected financial statement data for Enron Corporation as originally reported for 1997, 1998, 1999, and 2000. In 2001, Enron restated its financial
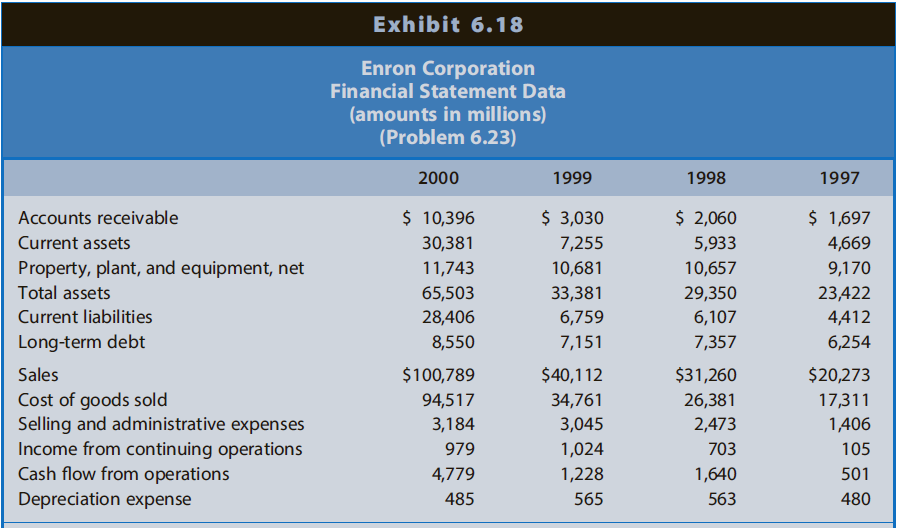
Exhibit 6.18 presents selected financial statement data for Enron Corporation as originally reported for 1997, 1998, 1999, and 2000. In 2001, Enron restated its financial statements for earlier years because it reported several items beyond the limits of U.S. GAAP.
REQUIREDa. Use Beneish??s earnings manipulation model to compute the probability that Enron engaged in earnings manipulation for 1998, 1999, and 2000.b. Identify the major reasons for the changes in the probability of earnings manipulation during the three-year period.
Exhibit 6.18 Enron Corporation Financial Statement Data (amounts in millions) (Problem 6.23) 2000 1999 1998 1997 Accounts receivable $ 10,396 $ 3,030 $ 2,060 $ 1,697 Current assets 30,381 7,255 5,933 4,669 Property, plant, and equipment, net 11,743 10,681 10,657 9,170 Total assets 65,503 33,381 29,350 23,422 Current liabilities 28,406 6,759 6,107 4,412 Long-term debt 8,550 7,151 7,357 6,254 Sales $100,789 $40,112 $31,260 $20,273 Cost of goods sold Selling and administrative expenses Income from continuing operations Cash flow from operations Depreciation expense 94,517 34,761 26,381 17,311 3,184 3,045 2,473 1,406 979 1,024 703 105 4,779 1,228 1,640 501 485 565 563 480
Step by Step Solution
3.34 Rating (157 Votes )
There are 3 Steps involved in it
a b The probability of manipulation increased over the three years Note however that the probabilities of 09 for 1998 and 24 for 1999 are below the pr... View full answer

Get step-by-step solutions from verified subject matter experts