

Question: Refer to the financial statement data for Hasbro in Problem 4.24 in Chapter 4. Exhibit 5.14 presents risk ratios for Hasbro for Year 2 and
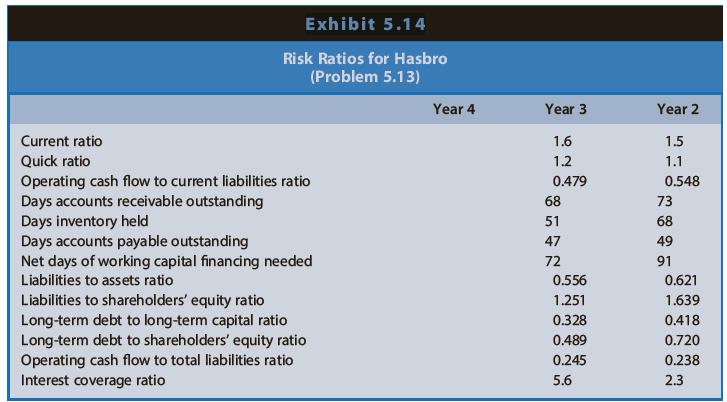
Refer to the financial statement data for Hasbro in Problem 4.24 in Chapter 4. Exhibit 5.14 presents risk ratios for Hasbro for Year 2 and Year 3.
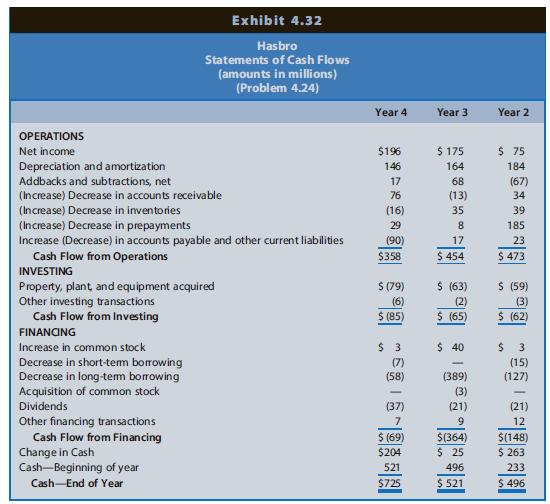
Problem 4.24
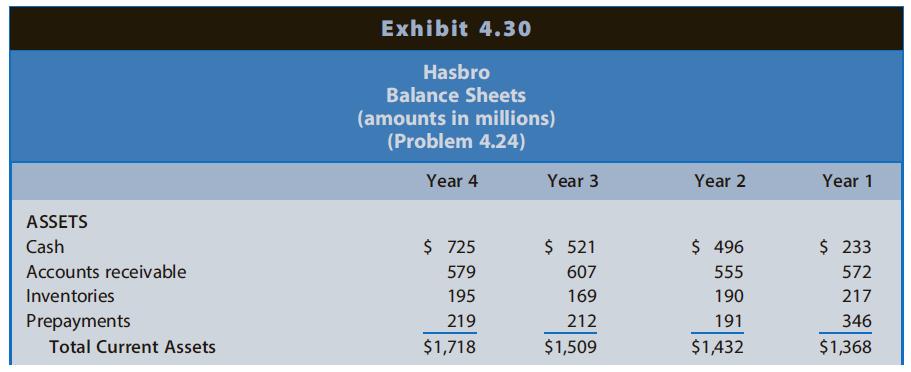
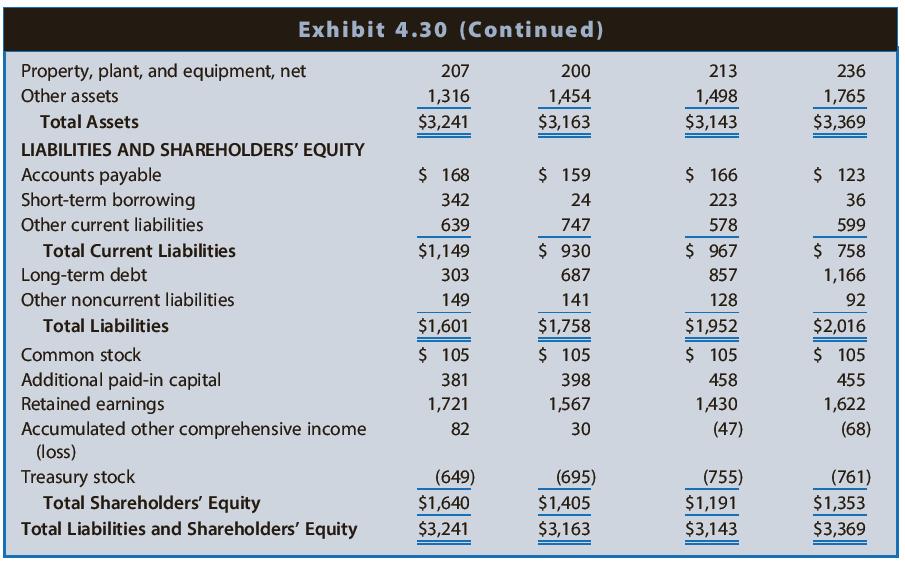
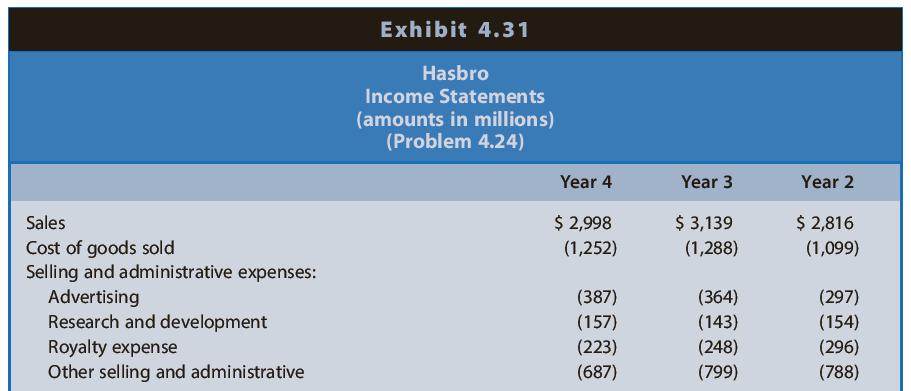
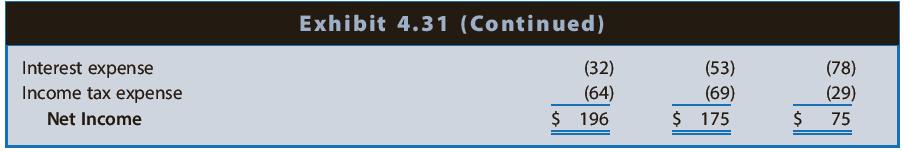
Calculating and Interpreting Profitability Ratios. Hasbro is a leading firm in the toy, game, and amusement industry. Its promoted brands group includes products from Playskool, Tonka, Milton Bradley, Parker Brothers, Tiger, and Wizards of the Coast. Sales of toys and games are highly variable from year to year depending on whether the latest products meet consumer interests. Hasbro also faces increasing competition from electronic and online games. Hasbro develops and promotes its core brands and manufactures and distributes products created by others under license arrangements. Hasbro pays a royalty to the creator of such products. In recent years, Hasbro has attempted to reduce its reliance on license arrangements, placing more emphasis on its core brands. Hasbro also has embarked on a strategy of reducing fixed selling and administrative costs in an effort to offset the negative effects on earnings of highly variable sales. Exhibit 4.30 presents the balance sheets for Hasbro for the years ended December 31, Years 1 through 4. Exhibit 4.31 presents the income statements and Exhibit 4.32 presents the statements of cash flows for Years 2 through 4.
REQUIRED
a. Calculate these ratios for Year 4.
b. Assess the changes in the short-term liquidity risk of Hasbro between Year 2 and Year 4 and the level of that risk at the end of Year 4.
c. Assess the changes in the long-term solvency risk of Hasbro between Year 2 and Year 4 and the level of that risk at the end of Year 4.
ASSETS Cash Accounts receivable Inventories Prepayments Total Current Assets Exhibit 4.30 Hasbro Balance Sheets (amounts in millions) (Problem 4.24) Year 4 $ 725 579 195 219 $1,718 Year 3 $ 521 607 169 212 $1,509 Year 2 $ 496 555 190 191 $1,432 Year 1 $ 233 572 217 346 $1,368
Step by Step Solution
3.49 Rating (162 Votes )
There are 3 Steps involved in it
a Current Ratio 17181149 15 Quick Ratio 725 5791149 11 Operating Cash Flow to Current Liabilities Ratio 35805930 1149 0344 Days Accounts Receivable 299805607 579 51 36551 72 days Days Inventory 125205... View full answer

Get step-by-step solutions from verified subject matter experts