

Question: Sun Microsystems, Inc., develops, manufactures, and sells computers for network systems. Exhibit 5.20 presents selected financial data for Sun Microsystems for each of the five
REQUIRED
a. Compute the value of each of the following risk ratios.
(1) Current ratio (at the end of Year 1€“Year 5)
(2) Operating cash flow to current liabilities ratio (for Year 2€“Year 5)
(3) Liabilities to assets ratio (at the end of Year 1€“Year 5)
(4) Long-term debt to long-term capital ratio (at the end of Year 1€“Year 5)
(5) Operating cash flow to total liabilities ratio (for Year 2€“Year 5)
(6) Interest coverage ratio (for Year 1€“Year 5)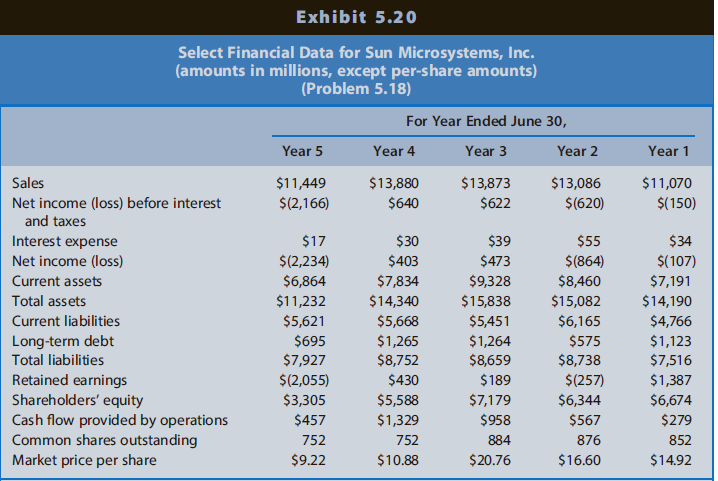
b. Compute the value of Altman€™s Z-score for Sun Microsystems for each year from Year 1 to Year 5.
c. Using the analyses in Requirements a and b, discuss the most important factors that signal the likelihood of bankruptcy of Sun Microsystems in Year 6.
Exhibit 5.20 Select Financial Data for Sun Microsystems, Inc. (amounts in millions, except per-share amounts) (Problem 5.18) For Year Ended June 30, Year 2 Year 5 Year 4 Year 3 Year 1 $13,086 Sales $11,449 $13,880 $13,873 $11,070 $622 $(150) Net income (loss) before interest and taxes $(2,166) $640 $(620) Interest expense Net income (loss) $17 $30 $39 $55 $34 $(2,234) $403 $473 $(864) $(107) Current assets $6,864 $7,834 $9,328 $8,460 $7,191 Total assets $11,232 $14,340 $15,838 $15,082 $14,190 Current liabilities $5,621 $5,668 $5,451 $6,165 $4,766 Long-term debt $695 $1,265 $8,752 $1,264 $8,659 $575 $1,123 $7,516 Total liabilities $7,927 $8,738 Retained earnings Shareholders' equity Cash flow provided by operations Common shares outstanding Market price per share $(2,055) $430 $189 $(257) $1,387 $3,305 $5,588 $7,179 $6,344 $6,674 $457 $1,329 $958 $567 $279 876 852 752 752 884 $9.22 $10.88 $20.76 $16.60 $14.92
Step by Step Solution
3.40 Rating (162 Votes )
There are 3 Steps involved in it
a 1 Current Ratio Year 1 71914766 151 Year 2 84606165 137 Year 3 93285451 171 Year 4 78345668 138 Year 5 68645621 122 2 Operating Cash Flow to Current ... View full answer

Get step-by-step solutions from verified subject matter experts