The following table provides historical percentage returns for the Patterson and Liston Funds along with percentage returns
Question:
The following table provides historical percentage returns for the Patterson and Liston Funds along with percentage returns on the market portfolio (index or fund):
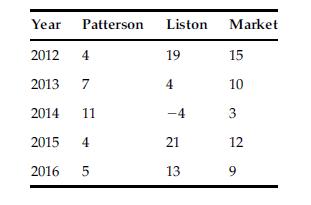
Suppose that the riskless rate of return (or T-Bill rate) was 3% for each year. Calculate the following based on the preceding table:
a. Mean historical returns for the two funds and the market portfolio.
b. Variances associated with Patterson Fund returns and Liston Fund returns along with returns on the market portfolio.
c. The historical covariance and coefficient of correlation between returns of the Patterson Fund and returns on the market portfolio.
d. The historical covariance and coefficient of correlation between returns of the Liston Fund and returns on the market portfolio.
e. Historical betas for Patterson and Liston Funds, based on five years of returns data.
f. Suppose that a market return of 8% was obtained in the year 2017, and that the riskless return for 2017 was 3%. Further suppose that the Patterson and Liston Funds earned 10% and 14%, respectively, over 2017. Based on a Treynor Index, how did each of these funds perform relative to the market?
g. Comment on the 2017 risk-adjusted performance for each of the two funds based on Treynor Index results.
Step by Step Answer:
a Average historical returns in decimal format are as follows R p 0062 R L 0106 R M 0098 b 2 P 00006...View the full answer