

Question: In the Universal Bank classification model estimated with XLMiner the software produced the validation data set lift chart shown. How is the nave model displayed
In the Universal Bank classification model estimated with XLMiner the software produced the validation data set lift chart shown.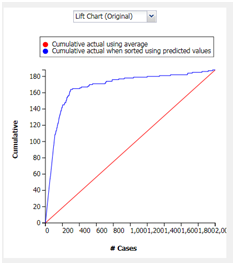
How is the naïve model displayed in the diagram? What does the other line in the model represent?
Lift Chart (Original) Cumulative actual when sorted using predicted values 180 160- 140- 120- 100 - 80- 60- 40- 20 O 200 400 600 800 1,0001,2001,4001,6001,8002,00 Cases Cumulative
Step by Step Solution
★★★★★
3.33 Rating (156 Votes )
There are 3 Steps involved in it
1 Expert Approved Answer
Step: 1 Unlock

The nave model is represented in the diagram by the 45degree l... View full answer
Question Has Been Solved by an Expert!
Get step-by-step solutions from verified subject matter experts
Step: 2 Unlock
Step: 3 Unlock