

A country has the following production possibility table: a. Draw the countrys production possibility curve. b. Whats
Question:
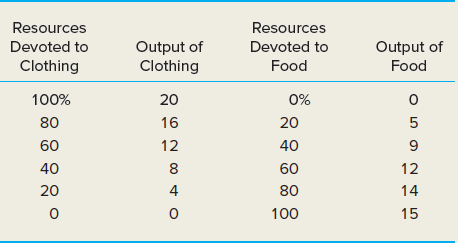
a. Draw the country€™s production possibility curve.
b. What€™s happening to the trade-off between food and clothing?
c. Say the country gets better at the production of food. What will happen to the production possibility curve?
d. Say the country gets equally better at producing both food and clothing. What will happen to the production possibility curve?
Fantastic news! We've Found the answer you've been seeking!
Step by Step Answer:
a See the accompanying graph b As the output of food increases the tr...View the full answer

Answered By
Mugdha Sisodiya
My self Mugdha Sisodiya from Chhattisgarh India. I have completed my Bachelors degree in 2015 and My Master in Commerce degree in 2016. I am having expertise in Management, Cost and Finance Accounts. Further I have completed my Chartered Accountant and working as a Professional.
Since 2012 I am providing home tutions.
2+ Reviews
10+ Question Solved
Related Book For 
Question Posted:
