

Consider the data in the table below: a. Calculate the Solow residual for each year from 2004
Question:
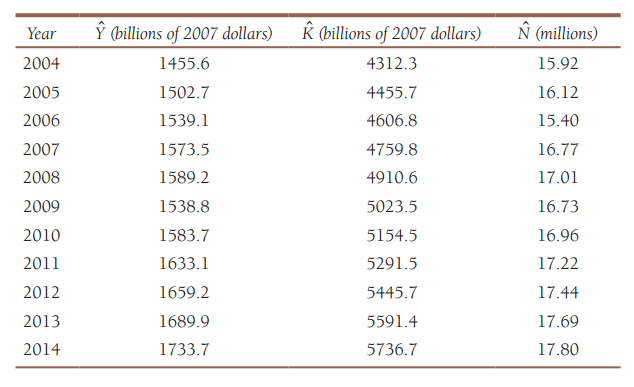
Consider the data in the table below:
a. Calculate the Solow residual for each year from 2004 to 2014.
b. Calculate percentage rates of growth in output, capital, employment, and total factor productivity for the years 2005 to 2014. In each year, what contributes the most to growth in aggregate output? What contributes the least? Are there any surprises here? If so, explain.
Fantastic news! We've Found the answer you've been seeking!
Step by Step Answer:
a Year Y K N z 2004 145556 4312258 15915 1703547 2005 1502688 4455671 161235 1725732 2006 1539058 46...View the full answer

Answered By
Sumit kumar
I am an experienced online essay writer with a thorough understanding of any curriculum.and subject expert at Chegg for mathematics, CS subjects..
5+ Reviews
13+ Question Solved
Related Book For 

Question Posted:
