

Draw the supply and demand curves associated with the tables below. a. What is equilibrium price and
Question:
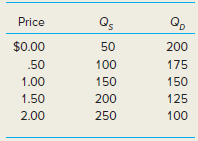
a. What is equilibrium price and quantity?
b. What is equilibrium price and quantity with a $0.75 per-unit tax levied on suppliers? Demonstrate your answer graphically.
c. How does your answer to b change if the tax were levied on consumers not suppliers? Demonstrate your answer graphically.
d. What conclusion can you draw about the difference between levying a tax on suppliers and consumers?
Fantastic news! We've Found the answer you've been seeking!
Step by Step Answer:
a The quantity supplied and demanded equal each other when the price is 100 The equilibrium price is ...View the full answer

Answered By
Nazrin Ziad
I am a post graduate in Zoology with specialization in Entomology.I also have a Bachelor degree in Education.I posess more than 10 years of teaching as well as tutoring experience.I have done a project on histopathological analysis on alcohol treated liver of Albino Mice.
I can deal with every field under Biology from basic to advanced level.I can also guide you for your project works related to biological subjects other than tutoring.You can also seek my help for cracking competitive exams with biology as one of the subjects.
2+ Reviews
10+ Question Solved
Related Book For 
Question Posted:
