

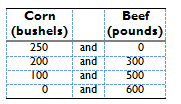
The table shows the quantities of corn and beef that a farm can produce in a year.
Question:
- An inefficient combination of corn and beef label this point A.
- An unattainable combination of corn and beef label this point B.
- An efficient combination of corn and beef label this point C.
Fantastic news! We've Found the answer you've been seeking!
Step by Step Answer:
The production possibilities frontier is illustrated i...View the full answer

Answered By
Shaira grace
I have experience of more than ten years in handing academic tasks and assisting students to handle academic challenges. My level of education and expertise allows me communicate eloquently with clients and therefore understanding their nature and solving it successfully.
4+ Reviews
10+ Question Solved
Related Book For 
Question Posted:
