

Draw a graph to illustrate the market equilibrium. On your graph, show the efficient quantity of water
Question:
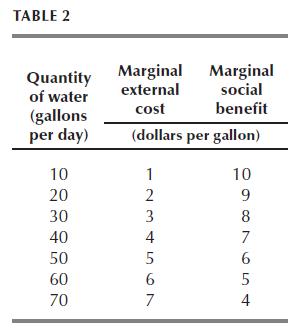
Draw a graph to illustrate the market equilibrium. On your graph, show the efficient quantity of water taken.
A natural spring runs under land owned by ten people. Each person has the right to sink a well and can take water from the spring at a constant marginal cost of $5 a gallon. Table 2 sets out the marginal external cost and the marginal social benefit from the water.
Step by Step Answer:

This question has not been answered yet.
You can Ask your question!
Related Book For 

Question Posted:
