

Table 1 shows the distribution of money income in Canada and Table 20.1(a) on p. 512 shows
Question:
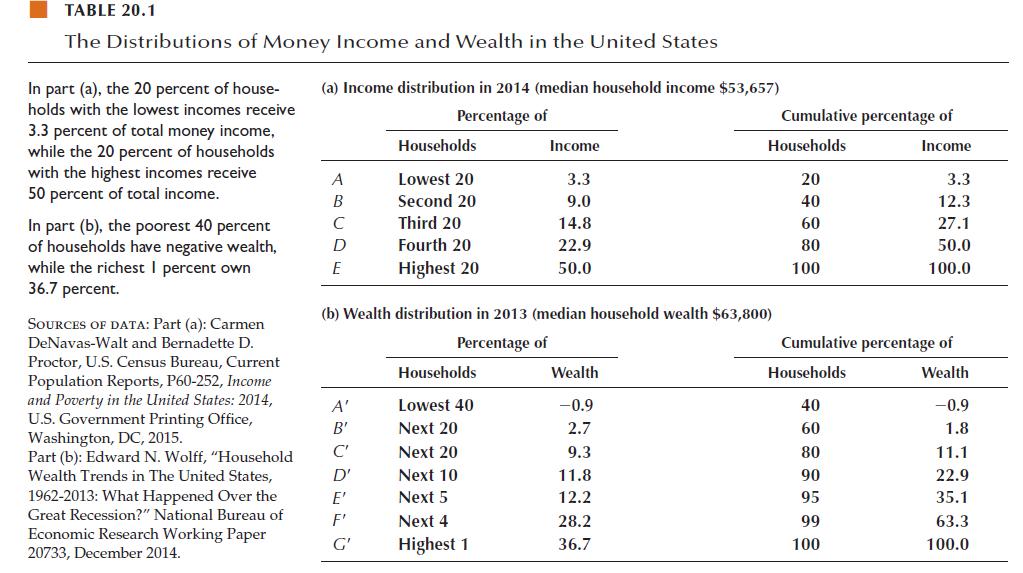
Table 1 shows the distribution of money income in Canada and Table 20.1(a) on p. 512 shows the distribution of money income in the United States.
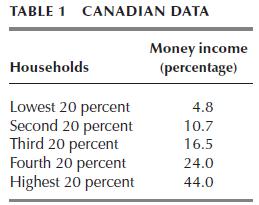
1. Create a table that shows the cumulative percentages of households and income in Canada.
2. Draw the Lorenz curves for Canada and the United States. Compare the distribution of income in Canada with that in the United States. Which distribution is more unequal?
Fantastic news! We've Found the answer you've been seeking!
Step by Step Answer:
1 Table 2 shows the cumulative percentages of Canadian households and income The lowest ...View the full answer

Answered By
Nazrin Ziad
I am a post graduate in Zoology with specialization in Entomology.I also have a Bachelor degree in Education.I posess more than 10 years of teaching as well as tutoring experience.I have done a project on histopathological analysis on alcohol treated liver of Albino Mice.
I can deal with every field under Biology from basic to advanced level.I can also guide you for your project works related to biological subjects other than tutoring.You can also seek my help for cracking competitive exams with biology as one of the subjects.
2+ Reviews
10+ Question Solved
Related Book For 

Question Posted:
