

Horizontal analysis (trend analysis) percentages for Kemplar Companys sales revenue, cost of goods sold, and expenses are
Question:
Horizontal analysis (trend analysis) percentages for Kemplar Company’s sales revenue, cost of goods sold, and expenses are shown below.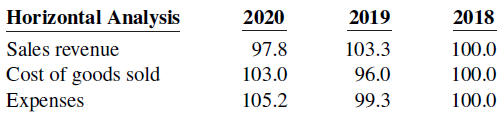
Did Kemplar’s net income increase, decrease, or remain unchanged over the 3-year period?
Fantastic news! We've Found the answer you've been seeking!
Step by Step Answer:
Comparing the percentages presented results in the following conclusions The n...View the full answer

Answered By
Munibah Munir
I've done MS specialization in finance’s have command on accounting and financial management. Forecasting and Financial Statement Analysis is basic field of my specialization. On many firms I have done real base projects in financial management field special forecasting. I have served more than 500 Clients for more than 800 business projects, and I have got a very high repute in providing highly professional and quality services.I have capability of performing extra-ordinarily well in limited time and at reasonable fee. My clients are guaranteed full satisfaction and I make things easy for them. I am capable of handling complex issues in the mentioned areas and never let my clients down.
467+ Reviews
648+ Question Solved
Related Book For 

Accounting Principles
ISBN: 978-1119419617
IFRS global edition
Authors: Paul D Kimmel, Donald E Kieso Jerry J Weygandt
Question Posted:
