

Figure 1. 2 in the text plots the mean-variance parabola of Markowitz. Why is the parabola curved
Question:
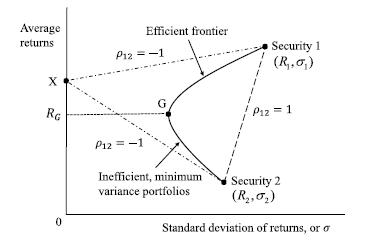
Figure 1. 2 in the text plots the mean-variance parabola of Markowitz. Why is the parabola curved in shape? What is the minimum variance portfolio? What is the efficient frontier? Are some portfolios on the parabola inefficient?
Figure 1.2
Fantastic news! We've Found the answer you've been seeking!
Step by Step Answer:

Answered By
Fahmin Arakkal
Tutoring and Contributing expert question and answers to teachers and students.
Primarily oversees the Heat and Mass Transfer contents presented on websites and blogs.
Responsible for Creating, Editing, Updating all contents related Chemical Engineering in
latex language
8+ Reviews
22+ Question Solved
Related Book For 
Investment Valuation And Asset Pricing Models And Methods
ISBN: 9783031167836
1st Edition
Authors: James W. Kolari, Seppo Pynnönen
Question Posted:
