

The following data represent measurements made on a process for 30 days. One measurement was made each
Question:
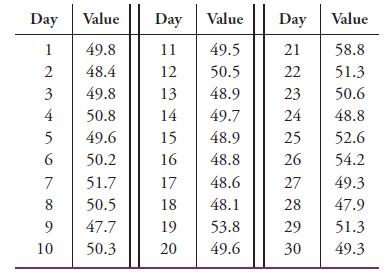
The following data represent measurements made on a process for 30 days. One measurement was made each day. Assuming that 30 measurements are enough that X ̅ → μ and s → σ, find the mean of the values, the standard deviation, and the upper and lower control limits. Plot the data points along with the statistical quantities on a chart, and determine whether the process was always in statistical control.
Step by Step Answer:

This question has not been answered yet.
You can Ask your question!
Related Book For 
Fundamentals Of Analytical Chemistry
ISBN: 9780357450390
10th Edition
Authors: Douglas A. Skoog, Donald M. West, F. James Holler, Stanley R. Crouch
Question Posted:
