

The following table shows the rates of total return in successive years from 2011 to 2015 for
Question:
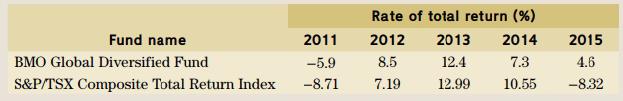
The following table shows the rates of total return in successive years from 2011 to 2015 for the BMO Global Diversified Fund Series T5 and for the benchmark Toronto Stock Exchange S&P/MX Composite Index. By how much did the mutual fund's overall percentage return exceed or fall short of the index's growth?
Fantastic news! We've Found the answer you've been seeking!
Step by Step Answer:
The value at the end of 2015 of an initial investmen...View the full answer

Answered By
Rehab Rahim
I am well versed in communicating and teaching in areas of all business subjects. I have helped many students in different ways from answering answers to writing their academic papers.
1+ Reviews
10+ Question Solved
Related Book For 

Fundamentals Of Business Mathematics In Canada
ISBN: 9781259370151
3rd Edition
Authors: F. Ernest Jerome, Jackie Shemko
Question Posted:
