

Today is March 29, 2019, and you have just started your new job with a financial planning
Question:
Today is March 29, 2019, and you have just started your new job with a financial planning firm. In addition to studying for all your license exams, you have been asked to review a portion of a client’s stock portfolio to determine the risk/return profiles of 12 stocks in the portfolio. Unfortunately, your small firm cannot afford the expensive databases that would provide all this information with a few simple keystrokes, but that’s why they hired you. Specifically, you have been asked to determine the monthly average returns and standard deviations for the 12 stocks for the past five years. The stocks (with their symbols in parentheses) are: Archer Daniels Midland (ADM) Boeing (BA) Caterpillar (CAT)Deere & Co. (DE) General Mills, Inc. (GIS) eBay, Inc. (EBAY) Hershey (HSY) Intel Corporation (INTC) JPMorgan Chase & Co. (JPM) Microsoft (MSFT) Procter and Gamble (PG) Walmart (WMT)
1. Collect price information for each stock from Yahoo Finance (finance.yahoo.com) as follows:
a. Enter the stock symbol. On the page for that stock, click “Historical Data”.
b. For the time period, enter the “start date” as March 1, 2014, and the “end date” as March 29, 2019, to cover the five-year period. Choose the monthly frequency.
c. After hitting Apply click “Download Data.”
d. Open the downloaded data in an Excel spreadsheet. Delete all the columns except the date and the adjusted close. Label the adjusted close column with the name of the stock.
e. Enter the next stock symbol in the main search box and search for the next stock. Repeat the above steps and download the historical price data for the new stock. Make sure you use the same dates as before and you select monthly data. Open the new data and copy the adjusted close data into the earlier spreadsheet. Label the adjusted close column with the name of the stock. Make sure the the first and last prices are in the same rows as the first stock and make sure they are lined up correctly. Do the same for the remaining stocks.
2. Convert these prices to monthly returns as the percentage change in the monthly prices. Note that to compute a return for each month, you need a beginning and ending price, so you will not be able to compute the return for the first month.
3. Compute the mean monthly returns and standard deviations for the monthly returns of each of the stocks.5 Convert the monthly statistics to annual statistics for easier interpretation (muliply the mean monthly return by 12, and multiply the monthly standard deviation by 212).
4. Add a column in your Excel worksheet with the average return across stocks for each month. This is the monthly return to an equally weighted portfolio of these 12 stocks. Compute the mean and standard deviation of monthly returns for the equally weighted portfolio. Double-check that the average return on this equally weighted portfolio is equal to the average return of all of the individual stocks. Convert these monthly statistics to annual statistics (as described in step 3) for interpretation.
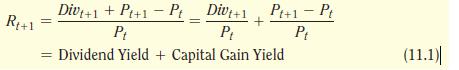
5. Using the annual statistics, create an Excel plot with standard deviation (volatility) on the x-axis and average return on the y-axis as follows: 5In Eq. 11.1, we showed how to compute returns with stock price and dividend data. The “adjusted close” series from Yahoo Finance is already adjusted for dividends and splits, so we may compute returns based on the percentage change in monthly adjusted prices.
a. Create three columns on your spreadsheet with the statistics you created in Questions 3 and 4 for each of the individual stocks and the equally weighted portfolio. The first column will have the ticker, the second will have annual standard deviation, and the third will have the annual mean return.
b. Highlight the data in the last two columns (standard deviation and mean), choose 7 Insert 7 Chart 7 XY Scatter Plot. Complete the chart wizard to finish the plot.
6. What do you notice about the average of the volatilities of the individual stocks, compared to the volatility of the equally weighted portfolio?
Step by Step Answer:

This question has not been answered yet.
You can Ask your question!


Fundamentals Of Corporate Finance
ISBN: 9780135811603
5th Edition
Authors: Jonathan Berk, Peter DeMarzo, Jarrad Harford
