

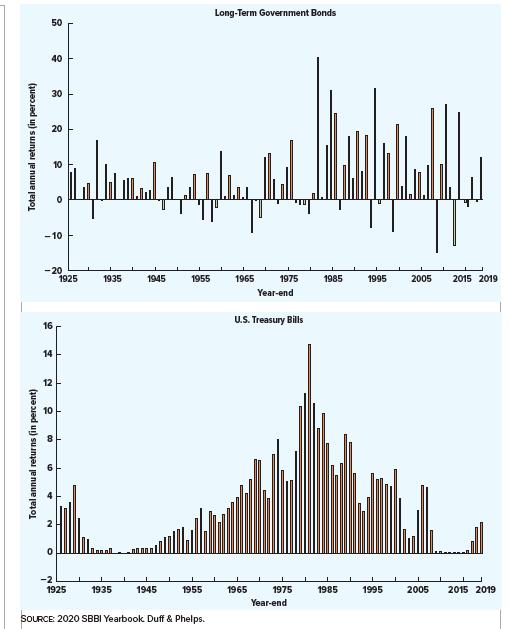
Look at Table 12.1 and Figure 12.7 in the text. When were T-bill rates at their highest
Question:
Look at Table 12.1 and Figure 12.7 in the text. When were T-bill rates at their highest over the period from 1926 through 2019? Why do you think they were so high during this period? What relationship underlies your answer?
Table 12.1
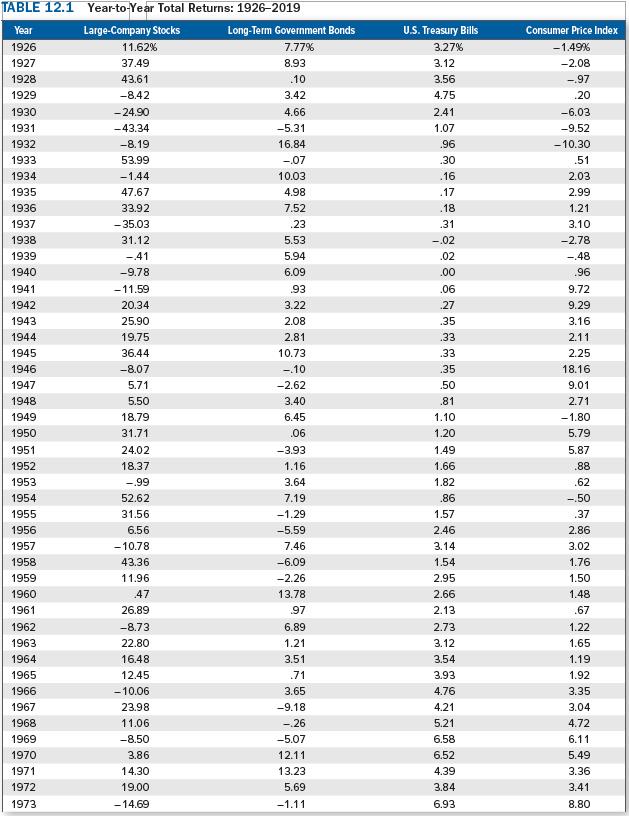
Figure 12.7
Fantastic news! We've Found the answer you've been seeking!
Step by Step Answer:
As we can see from the table 1...View the full answer

Answered By
Amarendra Biswal
I have completed my Bachelor in Commerce Degree in 2016. Currently I am pursuing Chartered Accountant Final Course. I have completed Certification courses in Equity market and derivative market from National Stock Exchange India(NSE). I have Secured All India Rank 1 in Financial Marketing Management Course in 2013. I have tutoring experience of 2 years in Chegg India Private Limited Plat form as a Finance and Accounts subject Matter experts. During my tutoring periods in Chegg, I have solved thousands of questions related to accounts and finance and have 90+CF score.
0 Reviews
10+ Question Solved
Related Book For 

Fundamentals Of Corporate Finance
ISBN: 9781265553609
13th Edition
Authors: Stephen Ross, Randolph Westerfield, Bradford Jordan
Question Posted:
