

The following table contains annual returns for the stocks of Home Depot (HD) and Lowes (LOW). The
Question:
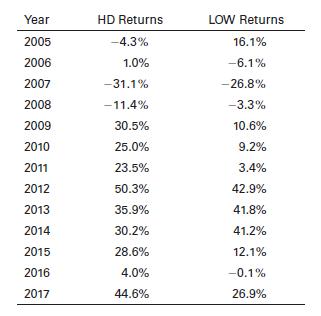
The following table contains annual returns for the stocks of Home Depot (HD) and Lowe’s (LOW). The returns are calculated using end-of-year prices (adjusted for dividends and stock splits) retrieved from http://www.finance.yahoo.com/. Use Excel to create a spreadsheet that calculates the return that an equally weighted portfolio of these two stocks would have earned in each year. Then calculate the average return and standard deviation for each stock over this period. Next, calculate the average return and standard deviation for a portfolio that invests 50% in HD and 50% in LOW. What is the correlation between HD and LOW returns over this period?
Step by Step Answer:
Excel formulas average stdevs correl You can also calculate it directly if you first find the p...View the full answer


Fundamentals Of Investing
ISBN: 9780135175217
14th Edition
Authors: Scott B. Smart, Lawrence J. Gitman, Michael D. Joehnk
