

Take a look back at Figure 1.1, which showed the value of a $1 investment after 96
Question:
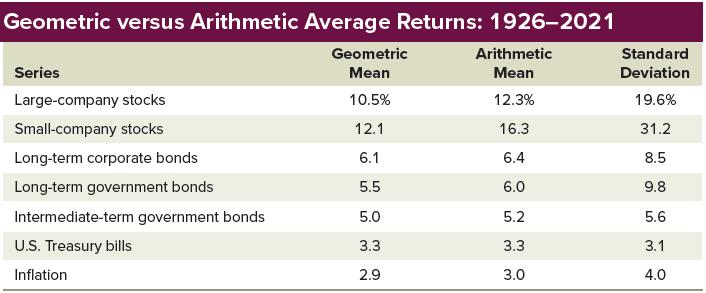
Take a look back at Figure 1.1, which showed the value of a $1 investment after 96 years. Use the value for the small-company stock investment to check the geometric average in Table 1.5.
Figure 1.1
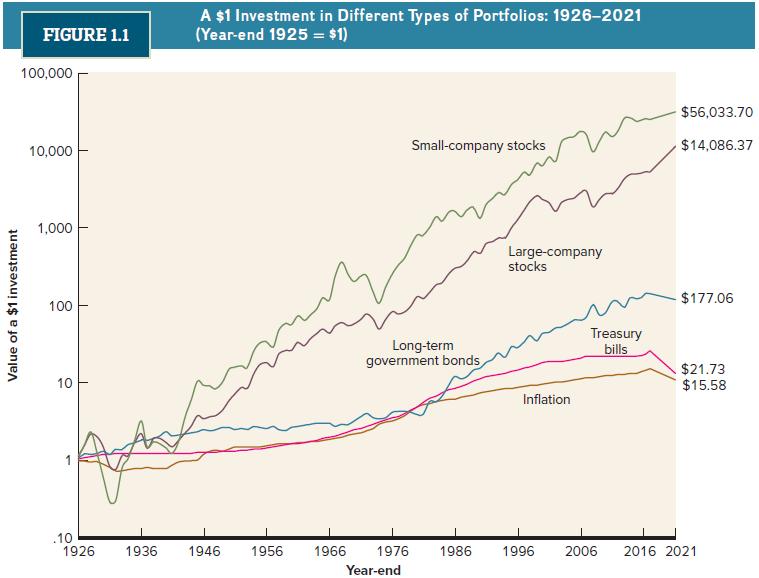
Table 1.5
Fantastic news! We've Found the answer you've been seeking!
Step by Step Answer:
In Figure 11 the smallcompany investment grew to 560337...View the full answer

Answered By
Joseph Mwaura
I have been teaching college students in various subjects for 9 years now. Besides, I have been tutoring online with several tutoring companies from 2010 to date. The 9 years of experience as a tutor has enabled me to develop multiple tutoring skills and see thousands of students excel in their education and in life after school which gives me much pleasure. I have assisted students in essay writing and in doing academic research and this has helped me be well versed with the various writing styles such as APA, MLA, Chicago/ Turabian, Harvard. I am always ready to handle work at any hour and in any way as students specify. In my tutoring journey, excellence has always been my guiding standard.
1+ Reviews
10+ Question Solved
Related Book For 
Fundamentals Of Investments Valuation And Management
ISBN: 9781266824012
10th Edition
Authors: Bradford Jordan, Thomas Miller, Steve Dolvin
Question Posted:
