

Correlation. Managers focus on growth rates for corporate assets and profitability as indicators of the overall health
Question:
The table shown here illustrates the correlation among these five key growth measures over a 10-year period for a sample of large firms taken from The Value Line Investment Survey.
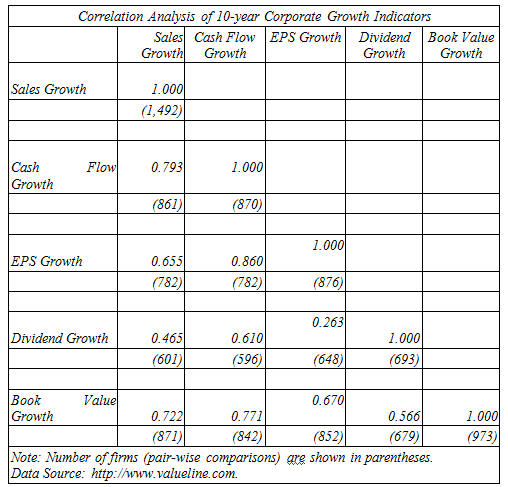
A. This correlation table only shows one-half of the pair-wise comparisons between these five measures. For example, it shows that the correlation between the 10-year rates of growth in sales and cash flow is 0.793 (or 79.3 percent), but does not show the corresponding correlation between the 10-year rates of growth in cash flow and sales. Why?
B. Notice the correlation coefficients between EPS growth and the four remaining corporate growth indicators. Use your general business knowledge to explain these differences.
Fantastic news! We've Found the answer you've been seeking!
Step by Step Answer:
A As is typical this correlation table shows only correlation statistics for onehalf of the potential pairwise comparisons The reason why is quite sim...View the full answer

Answered By
PALASH JHANWAR
I am a Chartered Accountant with AIR 45 in CA - IPCC. I am a Merit Holder ( B.Com ). The following is my educational details.
PLEASE ACCESS MY RESUME FROM THE FOLLOWING LINK: https://drive.google.com/file/d/1hYR1uch-ff6MRC_cDB07K6VqY9kQ3SFL/view?usp=sharing
3+ Reviews
10+ Question Solved
Related Book For 

Question Posted:
