

Consider Table 5-15 on the summary of patient satisfaction ratings. The percentages in each rating category are
Question:
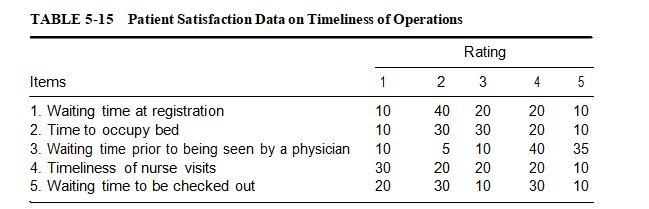
Consider Table 5-15 on the summary of patient satisfaction ratings. The percentages in each rating category are based on a response from a total of 200 patients from a prior year. For the item waiting time prior to being seen by a physician, consider the combined proportion of patients who are satisfied, that is, includes those in the category of very satisfied or satisfied. Suppose that, based on a survey during the current year, out of a total of 400 patients, 85% of them expressed a rating of very satisfied or satisfied. Can we conclude that there has been an increase in the overall proportion of satisfied patients from a prior year to the current year? Use a level of significance of 5%.
Table 5-15
Step by Step Answer:
To determine if there has been an increase in the overall proportion of satisfied patients from a pr...View the full answer


Fundamentals Of Quality Control And Improvement
ISBN: 9781118705148
4th Edition
Authors: Amitava Mitra
