

Table 13-9 shows data on diabetic patients and the development of retinopathy. The gender of the person,
Question:
Table 13-9 shows data on diabetic patients and the development of retinopathy. The gender of the person, the number of years that the person has been diagnosed with diabetes (labeled as Years), and whether the person has developed retinopathy (Y = Yes; N = No) are shown in the table.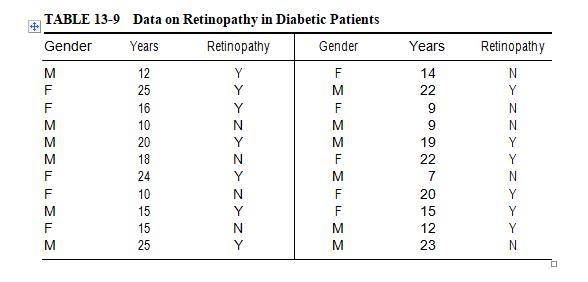
- (a) Fit an appropriate regression model to predict the probability of development of retinopathy based on years of diabetes. Is the model significant at α = 0.05.
- (b) Interpret the model coefficients.
(c) What is the odds ratio? Interpret it.
(d) Find a 95% confidence interval for the mean probability of developing reino pathy for persons who have had diabetes for 15 years.
Fantastic news! We've Found the answer you've been seeking!
Step by Step Answer:
Answer a The appropriate regression model to predict the probability o...View the full answer

Answered By
Justin Akengo
I am writing in application for the tutor position with your organisation. I am experienced in tutoring students of all abilities and I believe I am the ideal candidate for this position.
I work with students of all ages, from elementary school to college level. Whether the subject is science, Mathematics or basic study skills, I break material down into easy-to-understand concepts. In your job posting, you asked for someone who can tutor in a variety of subjects. I am comfortable explaining calculus to a college student or working with a kindergartener on spelling fundamentals.
Below are just a few core skills and qualifications I posses as a tutor;
Adept at creating study materials in a variety of academic subjects to help students improve their test scores and GPAs.
Strong interpersonal skills in working with students to help them achieve and succeed.
Have written study books adopted by a high school and a college to help students improve their skills in English and mathematics.
Have won several “Tutor of the Year” awards for work with high school and college students.
0 Reviews
10+ Question Solved
Related Book For 

Fundamentals Of Quality Control And Improvement
ISBN: 9781118705148
4th Edition
Authors: Amitava Mitra
Question Posted:
